When GBase 8a experiences occasional issues during stable operation, most are caused by [reason]. This article introduces the most common troubleshooting commands to pinpoint the fault location.
The OS commands mentioned below refer to execution in the Linux command line; SQL refers to execution in the gbase client, gccli.
Directory Navigation
Cluster status
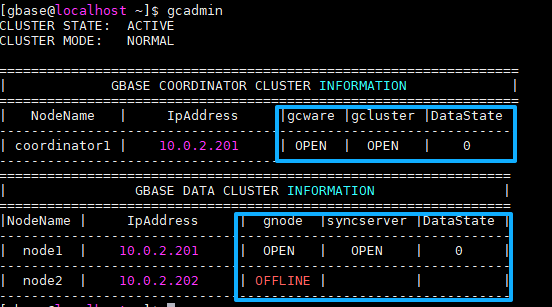
Execute the `gcadmin` command in the OS to view cluster node and service status. Emphasis on CLOSE, OFFLINE, etc.
Longest SQL running between cluster layers
Pay special attention to the runtime (time column). If it significantly exceeds the normal time, for example, if it's usually 1 minute but now takes 1 hour, then you can proceed to the next steps.
SELECT COORDINATOR_NAME, ID, user, host, command, start_time, time, state, SUBSTRING(info, 0, 100) AS info FROM information_schema.COORDINATORS_TASK_INFORMATION WHERE command = 'query' AND time >= 0 ORDER BY time DESC LIMIT 10;View which node executes the longest SQL statement
Similarly, check for excessively long execution times based on the "time" column. This usually matches the execution time of the previous step. For example, if the cluster layer took 3600 seconds and this step took 2900 seconds, they can generally be matched.
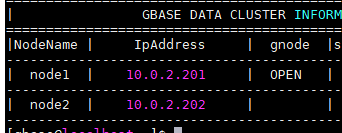
SELECT NODE_NAME, ID, user, host, command, start_time, time, state, SUBSTRING(info, 0, 100) AS info FROM information_schema.GNODES_TASK_INFORMATION where command='query' and info is not null and info is not like '%information_schema.processlist%' order by time desc limit 10;The first column of the execution output, node_name, corresponds to the node number, for example, node2. This number corresponds to the Nodename in the output of `gcadmin showcluster`. For example
Check the status of this node
Log in to the node via SSH and check the following aspects:
Are there any OS environment errors?
Execute the following OS commands
dmesg -T | grep -i errorBased on the output, determine if there are hardware, file system, or other types of failures.
Check if OS resources are busy
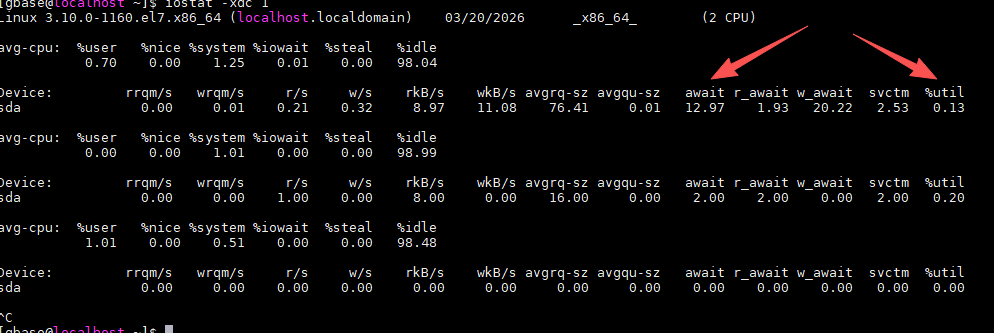
Execute the following OS command
iostat -xdc 1Pay close attention to whether the %util column at the end shows a persistent value of 100%. Also, check whether the await column further down exceeds 200.
Check if SWAP is being used
I recommend using the `top` command in `os`. It can also show you process CPU and memory usage.
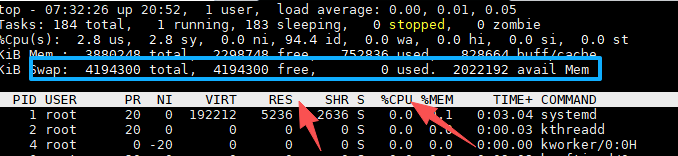
High swap usage and insufficient memory will lead to performance degradation.
Other troubleshooting
Loading speed
SELECT tb_name, IP, state, ELAPSED_TIME, avg_speed, progress, total_size, loaded_size FROM information_schema.load_status ORDER BY avg_speed;Generally, SFTP's average speed should be >= 8MB/s, while FTP is typically between 40-100MB/s.